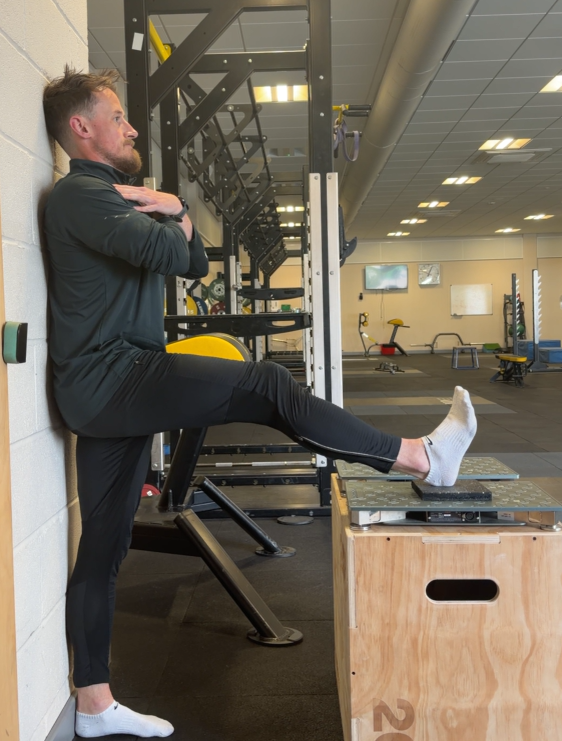
The 90:20 isometric hamstring test has become a popular method for assessing posterior chain/ hamstring function. It’s quick to perform, reliable and places the hamstrings in a long muscle length position; considered important for late stage return to sport assessments. Consequently, practitioners may use force outputs from this test to infer recovery of hamstring function following injury and influence return to sport decisions.
However in practice, force production is typically interpreted in relatively simple terms; higher force values and low between limb asymmetries are thought to indicate greater hamstring capacity and readiness to return to sport. But, this interpretation may not always be true, and in some cases may be misleading!
The Challenge of Testing at Long Muscle Lengths
The 90:20 position places the hamstrings close to their maximal length, with the hip flexed to 90 degrees and the knee positioned near extension (20 degrees). This is one of the reasons the test is clinically appealing. It challenges the hamstrings in a lengthened position, which appears relevant when assessing athletes returning to high-speed running.
However, at long lengths, force output likely reflects the combined contribution of active contractile force and passive tension generated within the musculotendinous unit. Not just the contractile contribution.
As the hamstrings lengthen, passive resistance begins to develop within the muscle, tendon and surrounding connective tissues. Post injury structural adaptations such as scar tissue formation, altered architecture, changes in resting muscle length and alterations in musculotendinous stiffness may all influence the passive behaviour of the tissue. As a result, force production, particularly when measured at long muscle lengths, may be influenced by factors beyond the contractile capacity of the muscle.
This raises an important question: Are we measuring how much force the athlete can actively produce, or are we measuring force at a joint position where passive tissues may also be contributing meaningfully to the output?
Looking Beyond Force Values
A common limitation of force testing is our tendency to focus solely on the output. If an athlete produces 350N on their injured limb and 350N on their uninjured limb, the conclusion is often that symmetry has been restored.
But in this test, that conclusion may be overly simplistic.
For example, one limb may generate the majority of the measured force through active contractile mechanisms, while the other may benefit from greater passive tension developing at long muscle lengths. Both limbs may produce the same peak force value, but the underlying physiological/ structural contributions may be very different.
Take the example presented below, an athlete may present with higher absolute force values in the recently injured hamstring (+6%), leading to the thought that this athlete is ready to return to sport. However, a large contribution of this force may come from an increase in passive tension of the hamstring (due to scar formation, architectural and neural adaptations etc). While the actual contractile contribution remains lower than the uninjured limb (15%).
| Uninjured Limb | Injured Limb | % difference | |
| Active Force | 200N | 170N | -15% |
| Passive Force | 100N | 150N | +50% |
| Absolute Force | 300N | 320N | +6% |
If we only look at total force, the injured limb appears stronger. But if passive tension is contributing more to the measured output, active contractile capacity may still be reduced. Peak force tells us what force output was produced. It does not tell us HOW that force was produced.
Understanding Passive Tissue Behaviour
One way to improve interpretation is to assess how passive resistance develops throughout range of motion, rather than simply documenting the end range achieved. Traditional flexibility testing focuses on maximal range. While useful, this tells us where movement ends and little about when resistance begins.
In my opinion, when utilising flexibility tests such as passive knee extension (PKE) it is important to consider both:
- R1 – the point at which passive resistance is first encountered (yes, subjective and hard to quantify).
- R2 – the maximal passive range of motion available.
This difference is important because two limbs may demonstrate identical end-range flexibility with very different passive tissue behaviours.
For example, both limbs may achieve 180 degrees during a passive knee extension test. However, passive resistance may begin at 120 degrees on one limb and 160 degrees on the other. Although the end range is identical, the mechanical characteristics of the tissues are clearly different.
An earlier R1 may reflect increased passive stiffness, altered tissue architecture, reduced extensibility or changes in stretch tolerance etc. While it does not tell us exactly which factor is responsible, it does provide useful clinical context:
If one limb begins to resist much earlier in range, and that same limb produces high force during a long-length isometric test, we should be cautious about assuming that force output reflects restored contractile function alone.
Why This Matters for Return to Sport
The challenge with any isolated force value is that it rarely explains how the athlete achieved the result. An athlete may demonstrate good symmetry during a 90:20 assessment while still presenting with meaningful differences in passive tissue behaviour. If force production is interpreted in isolation, there is a risk of overestimating recovery of true contractile function.
So what should I look for?
When using the 90:20 test, context is king:
- Combine the test with measures of tissue extensibility. Passive knee extension, straight leg raise and maximal hip flexion active knee extension (MHFAKE) assessments may provide useful information about available range, between-limb differences and the behaviour of the tissue through range.
- Consider where resistance begins, not just end range. R1 and R2 are subjective, but they can help frame whether two limbs achieve range in the same way.
- Look at baseline/ system force: baseline/ system force represents the force recorded during the quiet period before contraction. In a long-length test, higher baseline force values may indicate greater passive tension at the start position. This does not provide a perfect measure of passive stiffness, but it may provide useful context.
- Consider net peak force: Subtracting baseline force from peak force may provide a closer estimate of the active contribution to the test. However, this should still be interpreted cautiously, particularly when large asymmetries in passive range, R1 or baseline force are present.
- Do not interpret the 90:20 test in isolation! No single test tells us whether an athlete is ready to return to sport. The 90:20 test is one piece of the puzzle, not the puzzle itself.
But the most important message:
If you are using peak force values from the 90:20 test without considering passive tissue behaviour, you may be overestimating what the athlete can actively produce. And in return-to-sport decision making, that matters!